
Payal Singh
Crypto Analyst
TL;DR
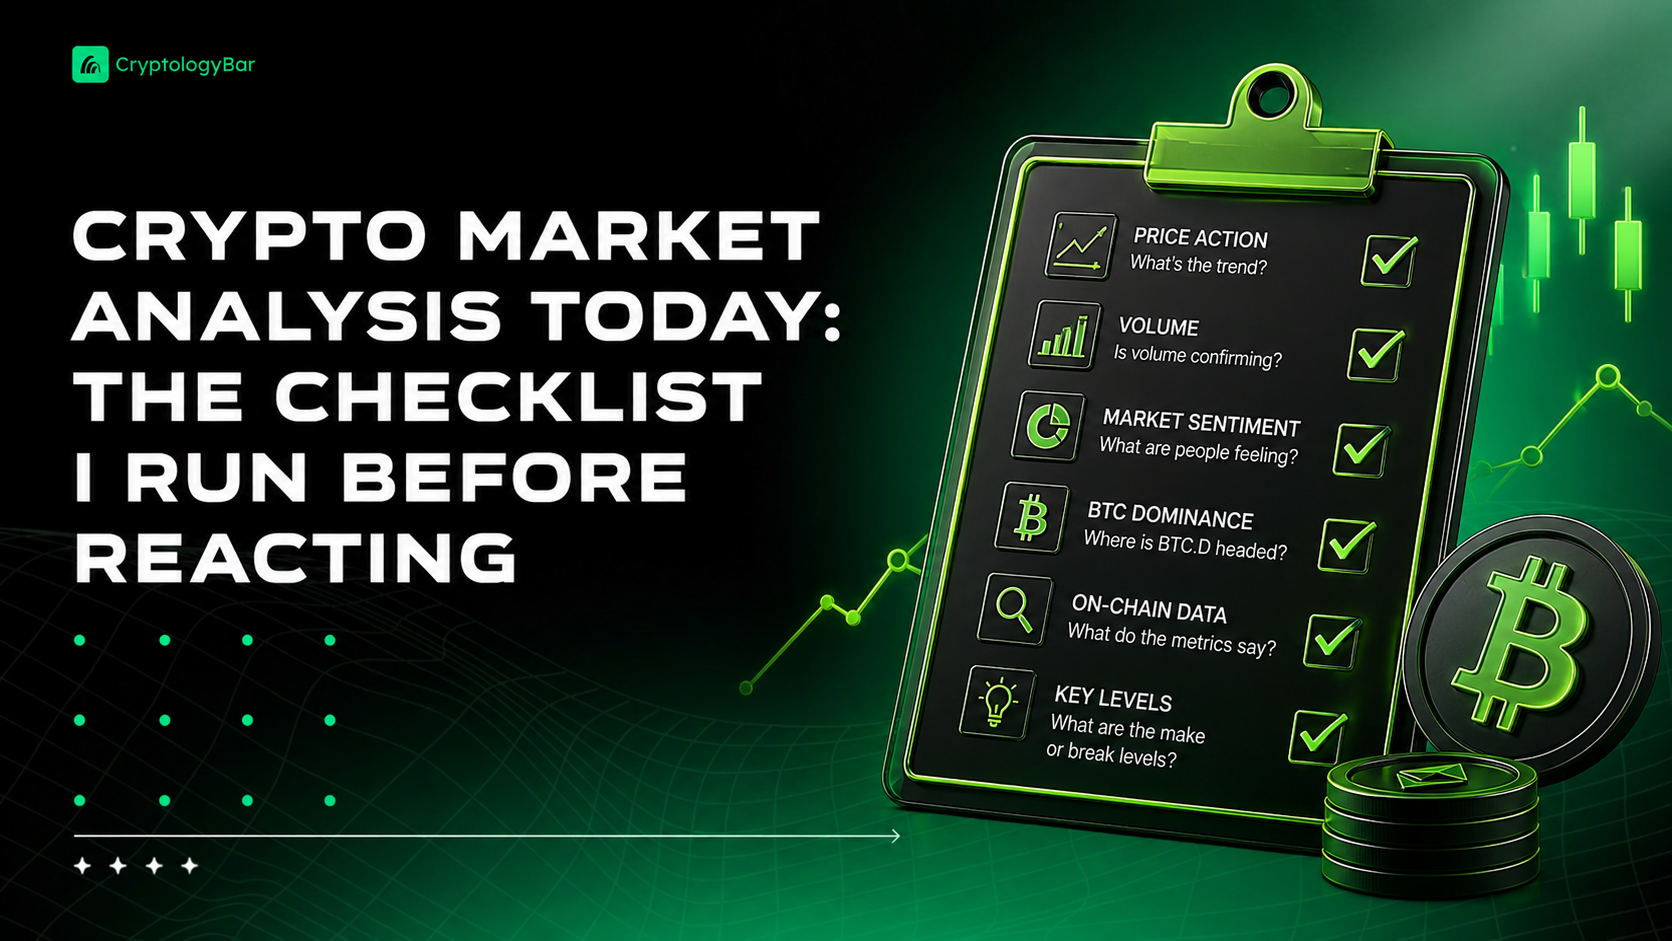
Crypto market analysis today works best as a repeatable checklist, not a guess. Look at Bitcoin first, then dominance, the Fear and Greed Index, macro conditions, the news calendar, volume, and chart levels. No single reading is a signal. A method beats reacting to one green or red day.
Key takeaways
- Start with Bitcoin. It leads the market, so check its trend and key levels before anything else.
- Bitcoin dominance tells you whether money is rotating into or out of altcoins.
- The Fear and Greed Index is a mood gauge, not a buy or sell button.
- Crypto increasingly tracks macro, so watch rates, the dollar, and stock-market risk appetite.
- No single indicator is a signal on its own. Reacting to one day's move is how people lose money.
Most people check the price, feel something, and act on the feeling. That's the whole process for a lot of folks. Green candle, buy more. Red candle, panic. I did the same thing for a while, and it cost me. So I built a routine instead, and crypto market analysis today, for me, means running the same short checklist before I touch anything.
The idea is boring on purpose. A method you repeat every day beats a hot take you invent every morning. It doesn't need to be complicated either. Seven things. That's it.
Let me walk through the order I actually use, because the order matters as much as the items.
Start with Bitcoin, always
Bitcoin leads. When it moves, everything else tends to follow, usually with more violence. So before I even glance at whatever small‑cap coin I'm curious about, I look at BTC. Is it trending up, down, or grinding sideways? Where's it sitting relative to the levels people keep talking about?
This one habit saves me from a lot of dumb trades. If Bitcoin is bleeding, my altcoin's pretty chart doesn't mean much. It's going to get dragged along. And if Bitcoin's ripping, weak alts sometimes get pulled up too, which is a different kind of trap. Context first. Coin second.
I keep it simple here. Trend and a couple of key levels. I'm not trying to predict the exact bottom or top. I just want to know which way the tide's running.
Check Bitcoin dominance next
Dominance is Bitcoin's share of the total crypto market. It sounds abstract until you realize what it tells you about where money's flowing.
Rising dominance usually means money's crowding into Bitcoin and away from alts. That can happen when people get nervous and want the safest crypto they know. Falling dominance often means the opposite, money rotating out into altcoins, which is the classic setup people point to during so‑called alt seasons.
I don't treat this as gospel. Dominance can rise because Bitcoin's pumping or because alts are dumping, and those are two very different stories. But glancing at it tells me whether the risk appetite inside crypto itself is expanding or shrinking. Cheap information. Worth thirty seconds.
Read the mood with Fear and Greed
The Fear and Greed Index rolls a bunch of inputs into one number, and it's a decent mood ring for the market. Extreme fear on one end, extreme greed on the other.
Here's how I use it, and how I don't. I use it to notice when the crowd's gone lopsided. When everyone's terrified, a lot of the selling may already be done. When everyone's euphoric, things tend to be stretched. That's context.
What I don't do is treat the number as a button. Buying just because it says fear, or selling just because it says greed, is a fast way to get chopped up. The index lags, and it can sit at an extreme for a while before anything actually turns. It's a gauge. Not a signal.
Zoom out to macro
This part used to be optional. Not anymore. Crypto trades a lot more like a risk asset these days, which means it moves with the big economic picture whether we like it or not.
So I check three things. What are interest rates and rate expectations doing? Is the dollar strong or weak? And are stock investors in a mood to chase risk or hide from it? When money's cheap and people feel bold, risk assets including crypto tend to catch a bid. When rates climb and the dollar's strong, that same money gets more cautious.
On days when big economic data drops, crypto can lurch around for reasons that have nothing to do with crypto. If you skip macro, you'll spend a lot of mornings confused about why your coin just moved five percent on no crypto news at all.
Scan the catalyst calendar
News moves markets, and some news is scheduled. I keep a loose mental calendar of what's coming.
The stuff I watch for:
- ETF flows, since steady inflows or sudden outflows say a lot about big‑money demand
- Regulation and legal news, which can whip a whole sector in an afternoon
- Large token release or releases, where a flood of new supply hits the market
- Hacks, exploits, and exchange trouble, which tank confidence fast
A big release or a nasty hack can override every other thing on this list. That's why I check it. I'd rather know a huge chunk of tokens is about to release than get surprised by the dump that sometimes follows.
Look at volume and liquidity
A price move without volume behind it is a weak move. I want to know if real participation is showing up.
Big rallies on thin volume make me suspicious. So do sharp drops that nobody's really trading into. Liquidity matters too, especially on smaller coins, because thin books mean a single large order can swing the price hard in either direction. If a coin barely trades, I treat any dramatic candle with a raised eyebrow.
Volume basically answers one question. Does the crowd actually agree with this move, or is it a few players pushing the price around?
Finish with the chart levels
Only now do I look at actual chart levels, and I keep it basic. Support, resistance, and the higher timeframes.
I care way more about the weekly and daily charts than the five‑minute one. The lower timeframes are noisy, and it's easy to talk yourself into a story from a single wiggle. Where has price bounced before? Where has it stalled? Those levels give me reference points, not certainties.
I'm not drawing forty lines and a fan of retracement levels. Just the obvious ones that a lot of eyes are watching, because those tend to matter simply because people are watching them.
Why one indicator never wins
Here's the thing that ties it all together. No single item on this list is a signal by itself.
Fear alone isn't a buy. A red day alone isn't a sell. Rising dominance alone doesn't tell you what to do. The value is in how the pieces line up. When Bitcoin's trend, the macro backdrop, sentiment, and volume all point the same direction, that's worth paying attention to. When they conflict, that's usually a sign to sit still.
Reacting emotionally to one green or red candle is how most people bleed money over time. The market is loud, and loud things feel urgent. The checklist slows me down enough to ask whether anything actually changed, or whether I'm just reacting to noise.
A method beats vibes. Not because the method's magic, but because it stops me from making the same panicked mistake over and over. I run the same seven checks, in the same order, and most days the honest answer is do nothing. That's fine. Doing nothing on purpose is a position too.
One more thing worth saying plainly. This is a framework for thinking, not a promise about outcomes. Markets do whatever they want, and a clean checklist won't save you from a genuinely bad decision or a black‑swan day. It just tips the odds toward being deliberate instead of reactive.
None of this is financial advice. It's the process I personally run, and you should adapt it to your own risk and situation. Build the habit first. The results, if they come, come from repeating the habit long after the excitement wears off.